Lane Detection: The 3 types of Deep Learning (non-OpenCV) algorithms
One day of 2014, I was comfortably lying on the sofa, looking at the firecamp of a luxury ski villa I rented with friends in Canada, when suddenly, something popped in my field of view:
"FIRE! FIRE! FIRE!" I yelled.
Within seconds, my friends and I gathered in the kitchen, and looked at our french fries taking fire and spreading in the wooden house. It was total panic. We had to find a way to avoid the fire from spreading to the entire house. I tried to throw a glass of water, but nothing stopped it. The fire was getting bigger...
Suddenly someone had a clever reaction: to use a fire extinguisher. It took my friend a long minute to cut the ropes and have it ready to work, but then he was able to extinct the fire in a second. "Pshhhhhtttt". This day, the fire didn't spread, and we could all have an amazing ski weekend, all thanks to a good immediate reaction.
Whether you're trying to stop a fire, or asked to build a self-driving car, the first thing you think of is often the leading and most important thing. When developing an algorithm, thinking wrongly first can set you in the wrong direction.
The first thing people think of when building a self-driving car is to implement lane detection. It's what Tesla and mobileye note as "mandatory", and what Sebastian Thrun (godfather of self-driving cars) notted as first, essential task in an interview.
Yet, if this is a great first reaction, the first intention of many engineers may not be the best. Indeed, I noticed most posts were explaining traditional OpenCV algorithms, made of very old functions no longer in use. This is why I wanted to create this post on Deep Learning, which is today what companies use. In fact, there are mainly 3 types of approaches that companies use to perform lane detection:
- Segmentation Approaches
- Anchor-Based Approaches
- Parameter Based Approaches
A note: When I talk about "lane detection", I will actually talk about the idea of "lane line detection". In research and common knowledge, these two are assimilated, although there should be different.
Let's take a look at how to detect lane lines!
Segmentation Approaches for Lane Line Detection
The first and most popular way to detect lane lines is by using image segmentation. It's actually something I worked on for many months as a self-driving car engineer, because it was essential, and because an algorithm name LaneNet was considered the best way to do it.
We have 3 things to understand:
- How to frame lane line detection as a segmentation problem
- Which architectures can be used?
- How to do curve fitting from segmentation masks?
How to frame lane detection as a segmentation problem
If you're used to image segmentation, you know what I mean: both our input and output are images. In fact, the output image is a segmentation mask with lane markings painted, just as at the bottom part of the image below:
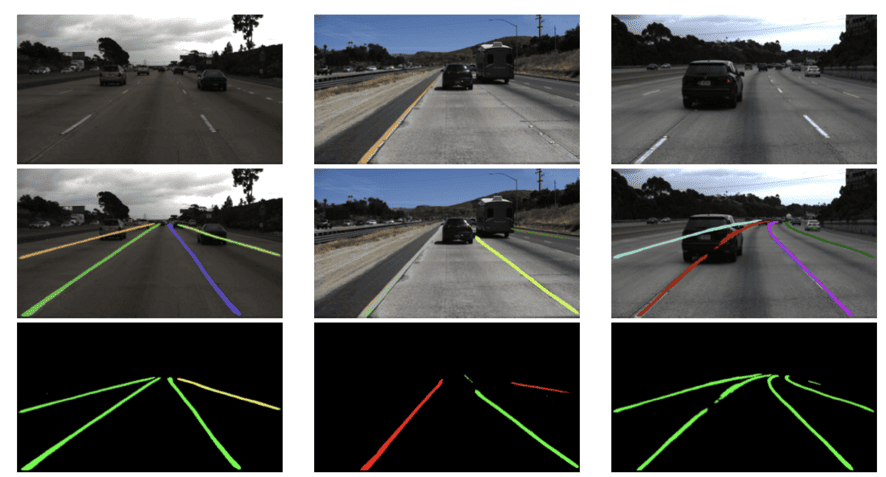
As you can see, our input is a set of images, but out labels are the same images, with overlayed segmented lines. Here, each color representing one line. This means we're not doing just image segmentation, but instance segmentation. Thanks to this, we can tell apart the left and right lines, but also solid from dashed, curves from straight, etc...
Which architectures can be used?
Most models used to perform segmentation are Encoder-Decoder architectures, and based on the dataset and labelling, you'll have more or less classes. Your task is to do pixel-wise instance classification (to classify each pixel).
The most popular architecture from this category (and maybe even in lane line detection) is LaneNet. So I'm going to do a deep dive on LaneNet, and then explore a few other models.
LaneNet Deep Dive
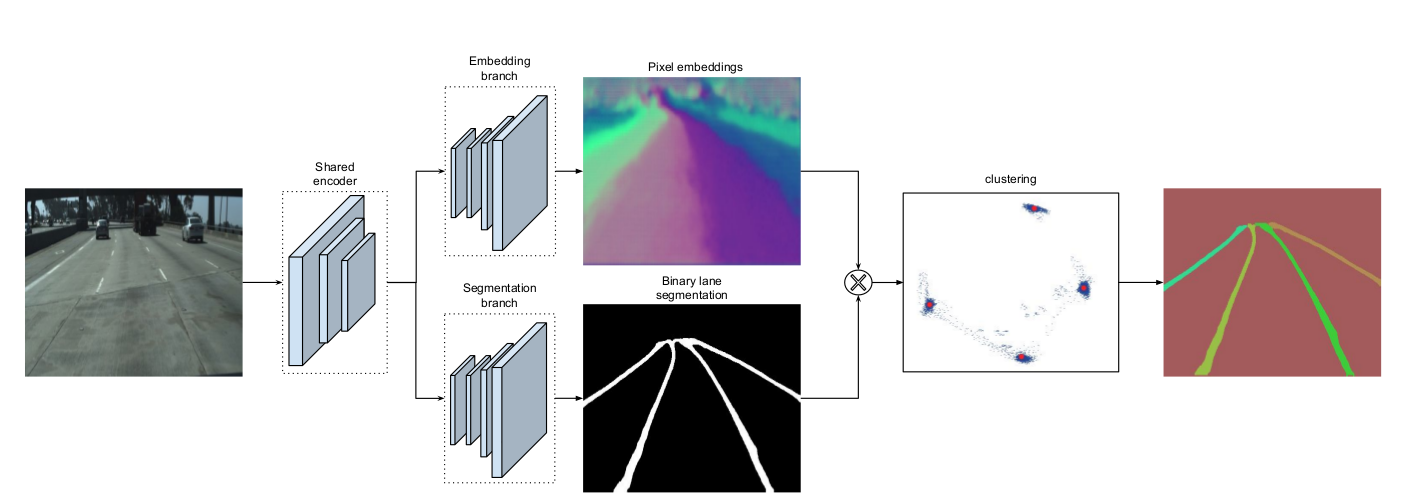
The input is an image, then is goes through an E-Net encoder (a pretrained image segmentation encoder), and then, two heads:
- The bottom head is a set of upsampling layers drawing a binary segmentation mask. This mask is binary, and simply answers the question "does this pixel belong to a line?"
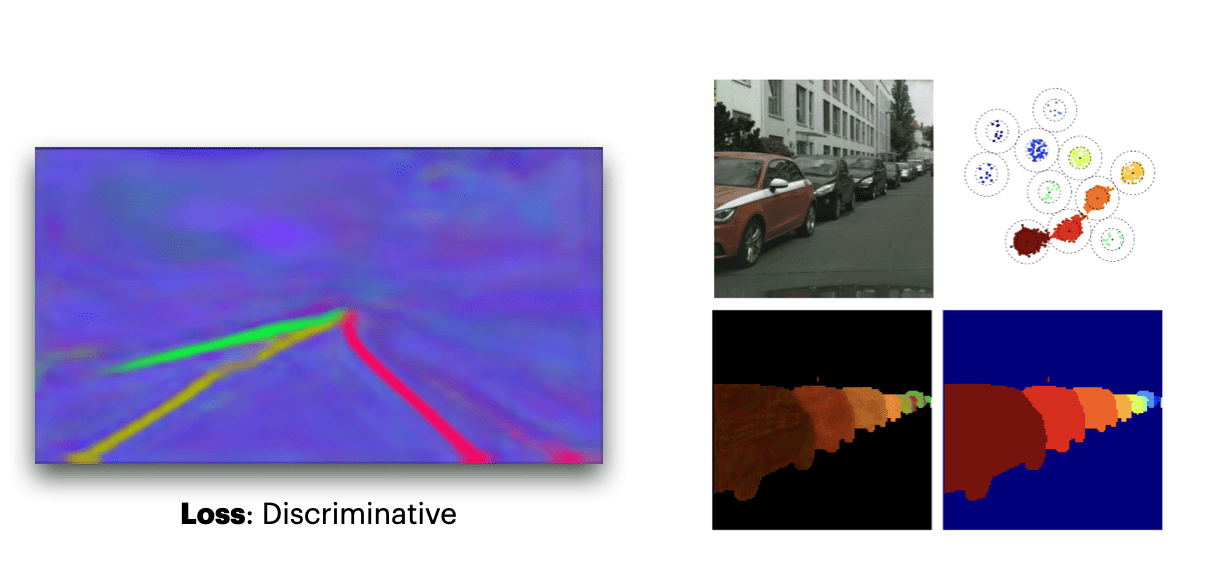
- The top head is a set of upsampling layers doing pixel embeddings. This term is intimidating, it's actually doing instance segmentation, which involves assigning a unique embedding (a set of feature values) to each pixel so that pixels belonging to the same lane line have similar embeddings and pixels belonging to different lane lines have dissimilar embeddings.
Here is, for example, a better visualization of these "embeddings".
We then combine these two and use post clustering (like DBSCAN) to combine the lines that have similar embeddings (features) together. So this was LaneNet, with one branch classifiying "line vs not line" and the other classifying "line A vs line B vs line C etc...", and then we cluster pixels from the same lines.
What other algorithms look like
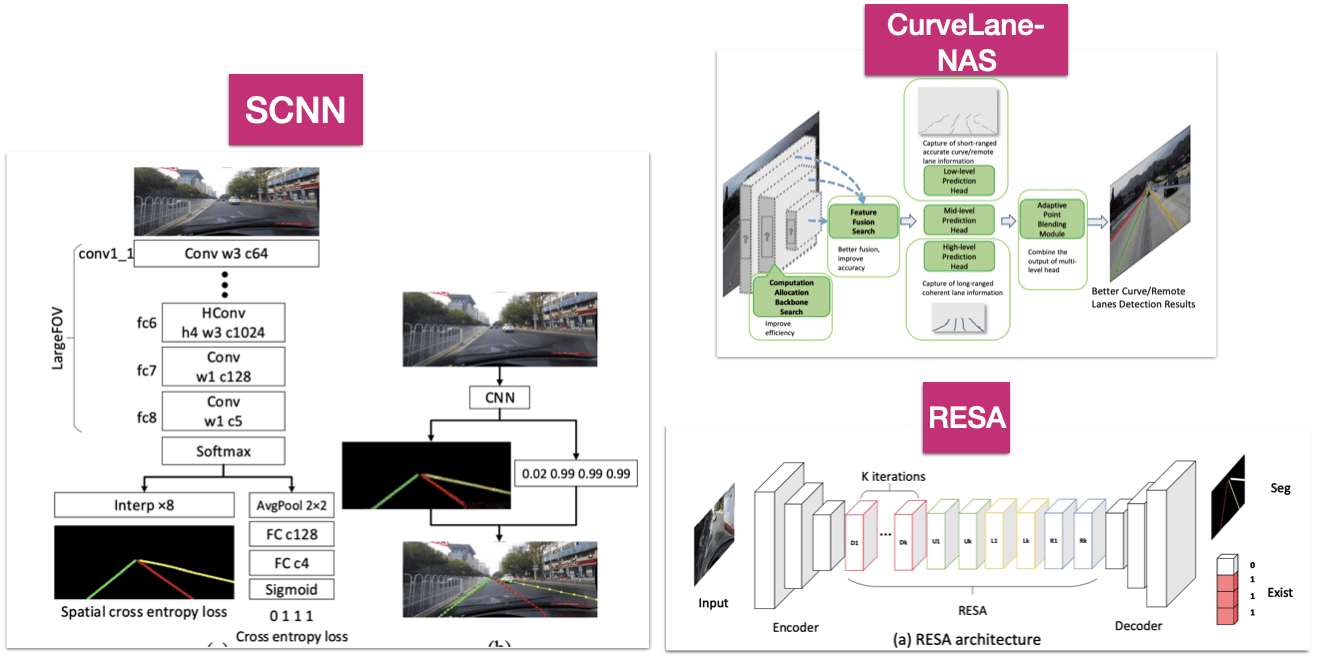
LaneNet is the pioneer in this category, but other architectures work even better, such as SCNN, RESA, or CurveLane-NAS.
- For example, SCNN (Spatial Convolutional Neural Network) enhances lane detection by employing spatial CNN layers, which enable it to consider horizontal connections between pixels, improving line continuity.
- RESA (REcurrent Spatial Attention) leverages spatial attention modules and a recurrent feedback mechanism, ensuring robust lane prediction by focusing on relevant spatial features across sequential processing stages.
- CurveLane-NAS uses Neural Architecture Search (NAS) to automatically identify optimal network architectures, ensuring the model is well-tuned for the specific task of curvilinear lane detection.
They all use different mechanisms inside, but the output will always be a segmentation mask.
Then comes the problem of converting a segmentation mask into something usable:
Curve Fitting
Imagine you're tackling your laundry: you diligently spend 15 minutes separating whites from colors, and an additional 5 minutes ensuring no delicate items are included. Carefully, you place everything into the washing machine and head off to work... only to realize en route that you forgot to actually start the wash cycle!
This is what happens when you're finding segmentation maps, but don't do curve fitting. Curve fitting is the process of fitting 2D or 3D curves to points from the same detected lanes.
There are 3 ways to do it:
- Direct Curve Fitting: This means fitting a curve directly within the image space and it involves finding a polynomial that will fit to most x and y coordinates of the detected lane points in the 2D plane. While straightforward, this methodology grapples with concerns about real-world accuracy (when reprojecting to 3D space) and managing vanishing points effectively (when do you stop fitting?).
- Bird-Eye-View Fitting: Most papers use Bird-Eye-View fitting. BEV typically employs homography, leveraging predetermined source and destination points to facilitate the conversion. Once transformed, a curve (commonly polynomial) is fitted to the lane points, offering a more straightforward, often more precise representation.
- Neural Network Fitting: In some algorithms like LaneNet, a neural network (called the "H-Net") is used to either directly predict polynomial coefficients or determine transformation parameters. So, the neural network does the fitting or BEV transformation.
So these are for the segmentation based approaches:
- Pros: They're simple to engineer and pixel-wise precise. They also rely on segmentation, so we can use transfer learning, and they also can detect infinite lanes without manually writing it.
- Cons: They're slow (only a few FPS), and treat each pixel the same way, so they won't understand the relationship between pixels of a same line.
The speed problem alone can create issues in autonomous driving and ADAS (advanced driver assistance systems), because we may not be able to do real time lane detection...
So let's see the second approach:
Anchor Based Lane Detection
The second technique is anchor based, and this is where you'll want to, rather than segmenting, do a regression of some values. The most popular algorithms here are Line-CNN, LaneAtt, SGNet, and CondLaneNet.
Here, we need to understand 2 things:
- What are anchors?
- How an Anchor Lane Detection model works
What are anchors?
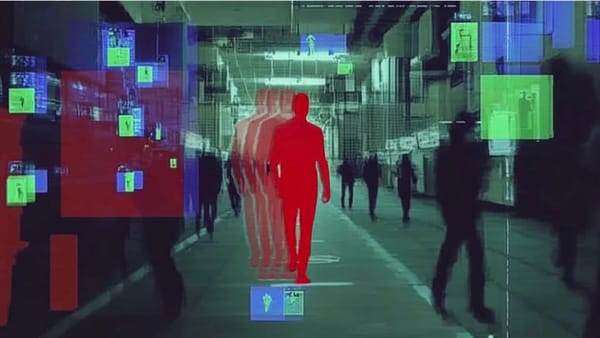
In any case (anchor or else), if you don't predict a mask, you'll predict numbers directly. But what numbers? Notice the use of the word "Anchor"... where have you seen this word before? Yes! in Object Detection! In object detection, you can sometimes use anchors that are predefined bounding boxes (a pedestrian is often vertical, small, etc...).
If you need a refresher, I have a great article on anchor boxes here.
In anchor based object detection, your model begins by placing anchor boxes all over the place. If detecting pedestrian for example, most of these boxes will be vertical boxes, and you use that knowledge as prior. You then predicts the "shift"or adjustment between detected bounding boxes and the anchor boxes.
Similarly, we can have assumptions on what a line should look like... It can be a straight line, or a curve, it can be dashed, or solid... and guess what? We can use this information as 'anchor'.
Intuitively, the key idea would look like this:
- Anchor Generation — Anchors, which are predefined lines, are generated across the image. In lane detection, these might be lines or curves representing possible lane positions and shapes. They also might be created at different scales and aspect ratios to detect lanes of various sizes and orientations. Usually, we then use techniques like Intersection over Union (IoU) to match anchors to ground-truth lines/boxes.
- Anchor "Shift"/Deviation: The model predicts adjustments to the anchors, tuning their position, shape, and size to closely align with the actual lanes in the image. In some cases, we may also want to predict class probabilities (e.g., solid vs. dashed lane) for each anchor.
- Non-Maxima Suppression & Prediction: NMS removes redundant predictions by keeping only the anchor with the highest probability in regions where multiple anchors overlap and suppressing the others.The remaining anchors after NMS represent the model’s final predictions for the positions and shapes of lanes.
So, this is what happens in object detection, and we can model this for lines, just that we use different anchors. Most models more or less try to follow this, let's see for example LaneATT, which is the state of the art in this category.
How an Anchor Lane Detection model works
There are several models, so let me begin with the most common and state of the art, and then show you other approaches.
Deep Dive in the LaneATT Model
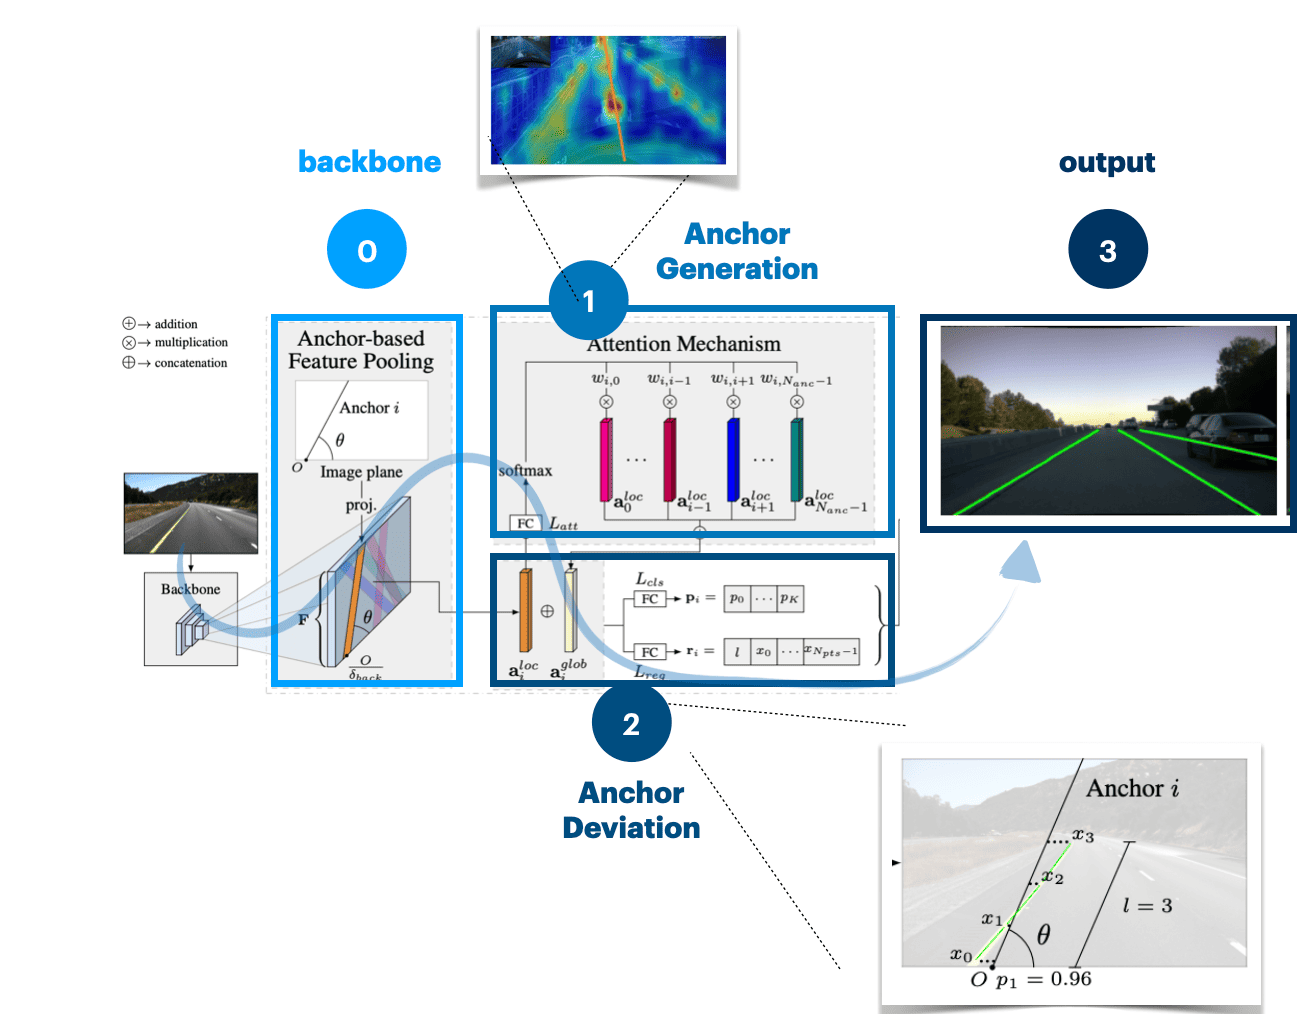
Take a look at the following image, it implements more or less what we described:
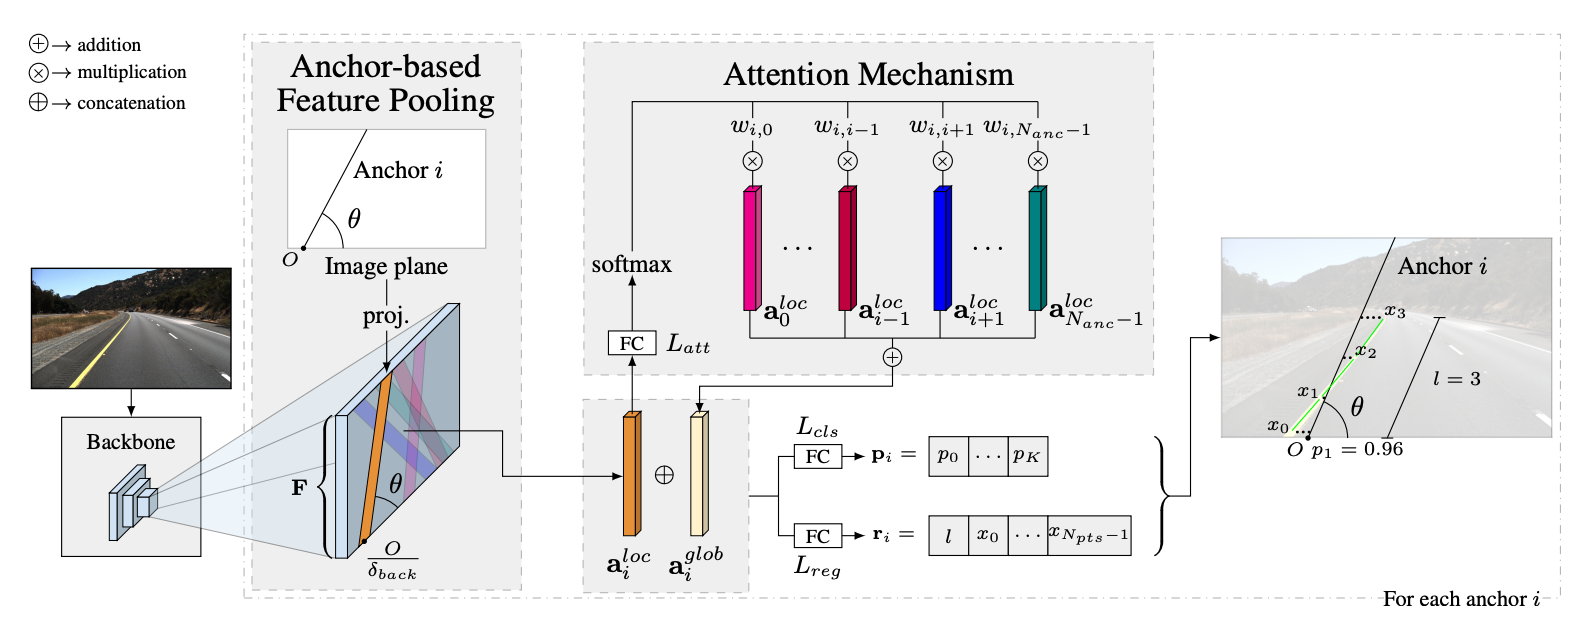
It may not be obvious, so try to note what happens here:
(step 0.) Feature Extraction: We take the image to a backbone CNN. (nothing to note here, it's a step 0 to keep consistency with previous part)
- Anchor Generation: Here, we use Attention to generate the anchors. Rather than having anchors everywhere, we use attention on top of the feature maps to give locations where lines may be present. Attention is going to focus on planar and linear regions, and we'll then put our anchors here. It will avoid having lines in the sky and on regions where there won't be lines.
- Anchor "Shift"/Deviation: For every anchor, we try to predict the deviation values to get the actual lane line. This is a classic regression. We also do a classification step, where we predict the type of line (dashed vs solid, etc...)
- Non-Maxima Suppression: We run suppresion over all the overlapping detected lane lines lines, to get only a few.
So, if we look at the drawing again, it looks like this:
And that is the example of how we can use anchors. In object detection, and I assume in lane line detection, anchors are based on the dataset you're using, and clustering made on all lines and their categories (if most lane lines are inclined to the right, we'll use it as anchor, etc...).
What other algorithms look like
Other techniques may do a bit differently, and for example, use row-wise classification, conditional prediction, multi-scale prediction, or other attention based models, ...
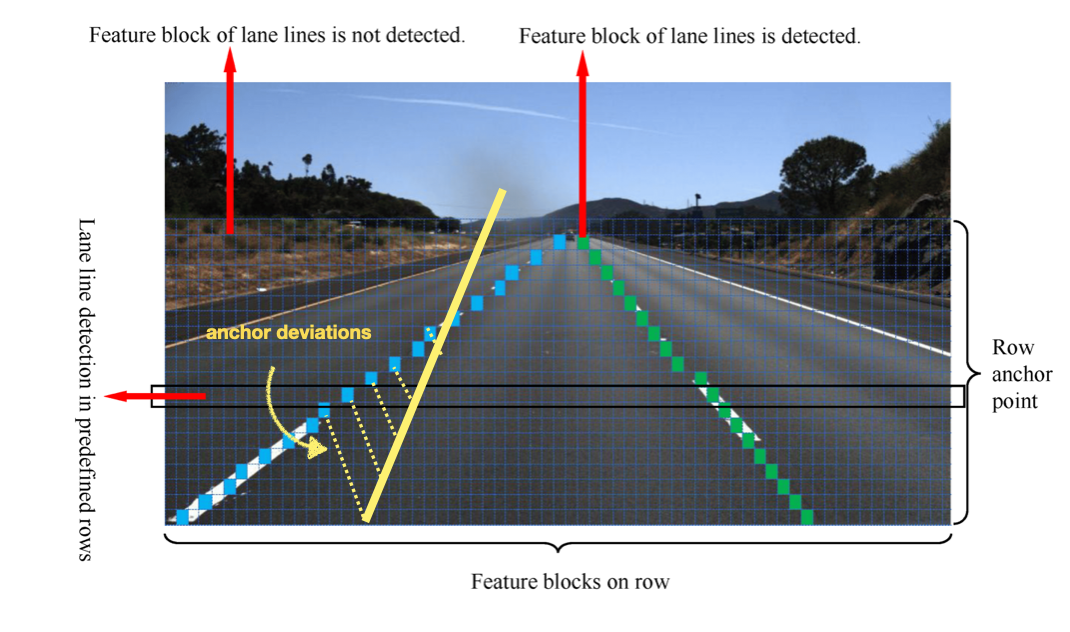
The most advanced models like LaneATT use Attention, and some of them use RNNs to not only predict one point of a line, but a sequence of points. (hey! I was talking about it in the Optical Flow course, too bad if you didn't join!) So this concludes our second approach: we want to regress anchor deviations.
This is why I'd also like to mention CondLaneNet, which is an extension of LaneNet with an understanding of context (road, lane lines, etc...). It does so using several mechanisms, like Self-Attention, RNNs, and Conditional Convolutions.
See in this video how the model performs in a new environment:
Finally:
Parameter Based Lane Detection
In this final technique, we'll try to regress not deviation numbers, but polynomial coefficients. After all, a lane line is nothing but either a line, or a curve, right? So, rather than trying to define a lane line by a set of point, we can define it by an equation.
Si let's look at the simplest yet most powerful technique: The PolyLaneNet algorithm:
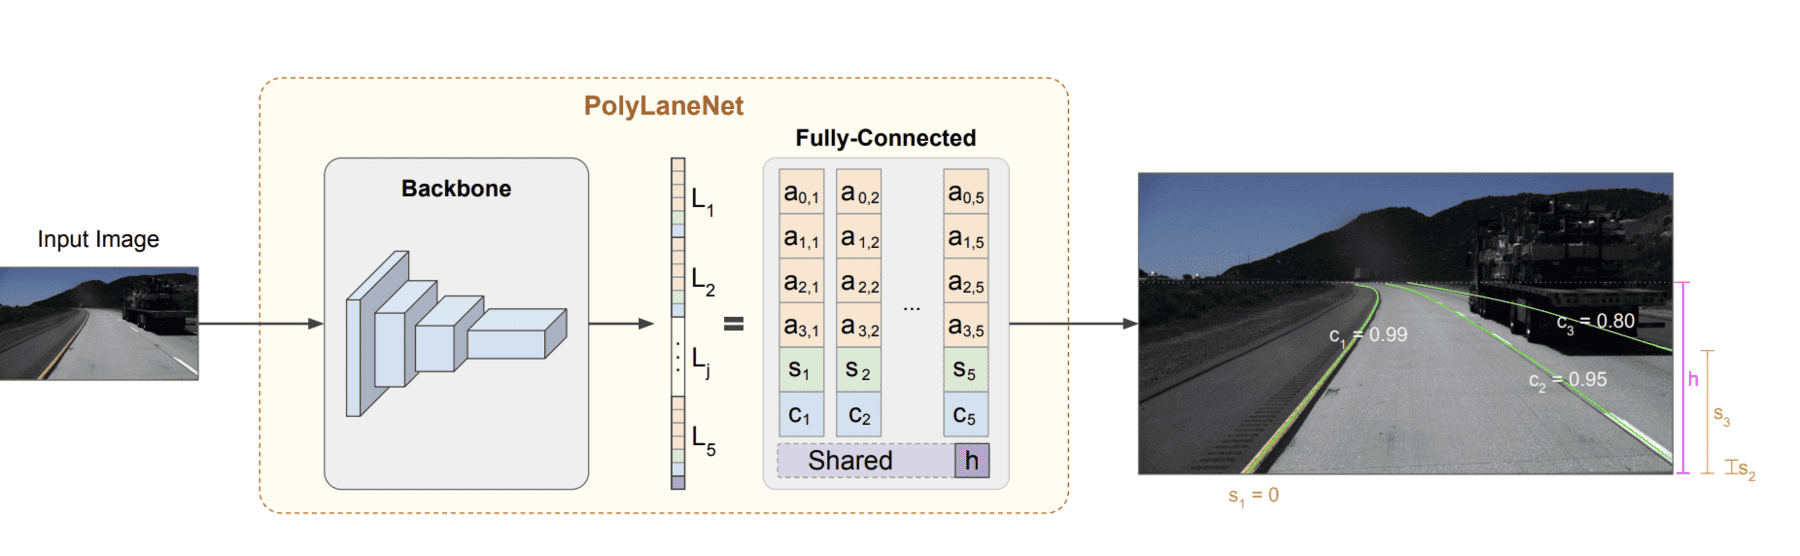
Rather than anchors or segmentation masks, we assimilate the line as an equation (as we did for curve fitting), and try to regress the coefficients. This is faster, simpler but maybe difficult to generalize. It also raises two questions:
- Which polynomial do we fit?
- How many neurons should we use at the end?
Which polynomial do we fit?
If you're used to polynomial, you now we have several of these, for example:
- First order: ax+b, the equation of a straight line
- 2nd order: ax² + bx + c, the equation of a simple curve
- 3rd order: ax³ + bx² + cx + d, the equation of a more complex curve
Which one is it for autonomous driving? Most algorithms use third order polynomial regression. It's the case for PolyLaneNet, but also LSTR, a Transformer based End-To-End model that also regress the polynomial coefficients.
How many neurons are used in the end?
That will depend on algorithms. If we fit a third order, we have 4 parameters to guess for each line (a, b, c, d). What I saw in PolyLaneNet was a fixed number of lines being used, let's say 4, and if we have less than 4, so this is 16 output neurons. If there are less lines, some neurons outputs will be disregarded.
What about the traditional OpenCV lane detection approach?
When I first started with Computer Vision and lane line detection, it was with the Udacity Self-Driving Car Nanodegree, which had its own lane line detection project. In fact, it had two, one with straight lines, and another with curves.
Both of these projects included traditional Computer Vision techniques line canny edge detection, hough transform, region of interest, turning into a grayscale image, run a sliding window, picking the high intensity values, and everything that will apply traditional algorithms on the original image. You can find many opencv approaches in Python online for these, but I prefer to tell you...
I tried to use that in an autonomous shuttle, it failed completely. Not only was it not robust enough to work on my scenarios and lines (in France), but it was also extremely slow. A few FPS maximum, it took forever on video frames, and this because of the use of traditional techniques.
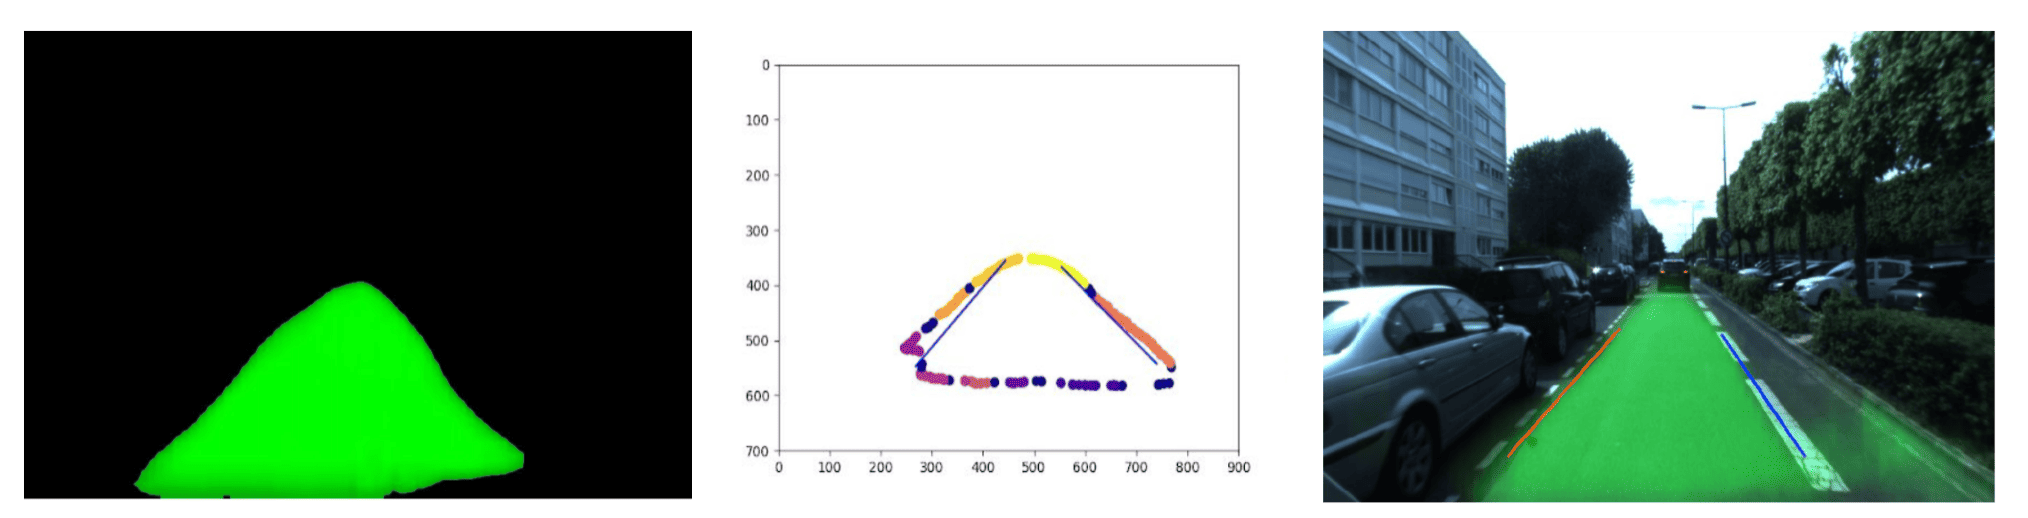
Example of one of my projects:
Therefore tried other approaches, that were hybrid of traditional, and Deep Learning. One of them involved finding the driveable area, and then taking the contours as lines. The drivable area detection ran extremely fast (100 FPS on a 1070) and was very reliable, but also had generalization issues, especially when I took the contours.
Example:
Unless you have a strong reason to use traditional approaches (other than lack of knowledge), I would recommend to go with Deep Learning. You have 3 approaches to go to, so let's now see some examples, and do a summary...
Example #1: Nvidia's LaneNet
Nvidia makes lots of videos where they showcase their work in Perception. One of these videos is about an algorithm they call LaneNet. It may be our LaneNet, or a custom one, but here is the explainer video and the results:
Example #2: Tesla's Lane Language
Tesla is also big on lane line detection. For that, they built an extension of their HydraNet, just for Lane Detection. This means they have heads to detect objects, traffic signs, etc... and one head that is another neural network just for lane lines.
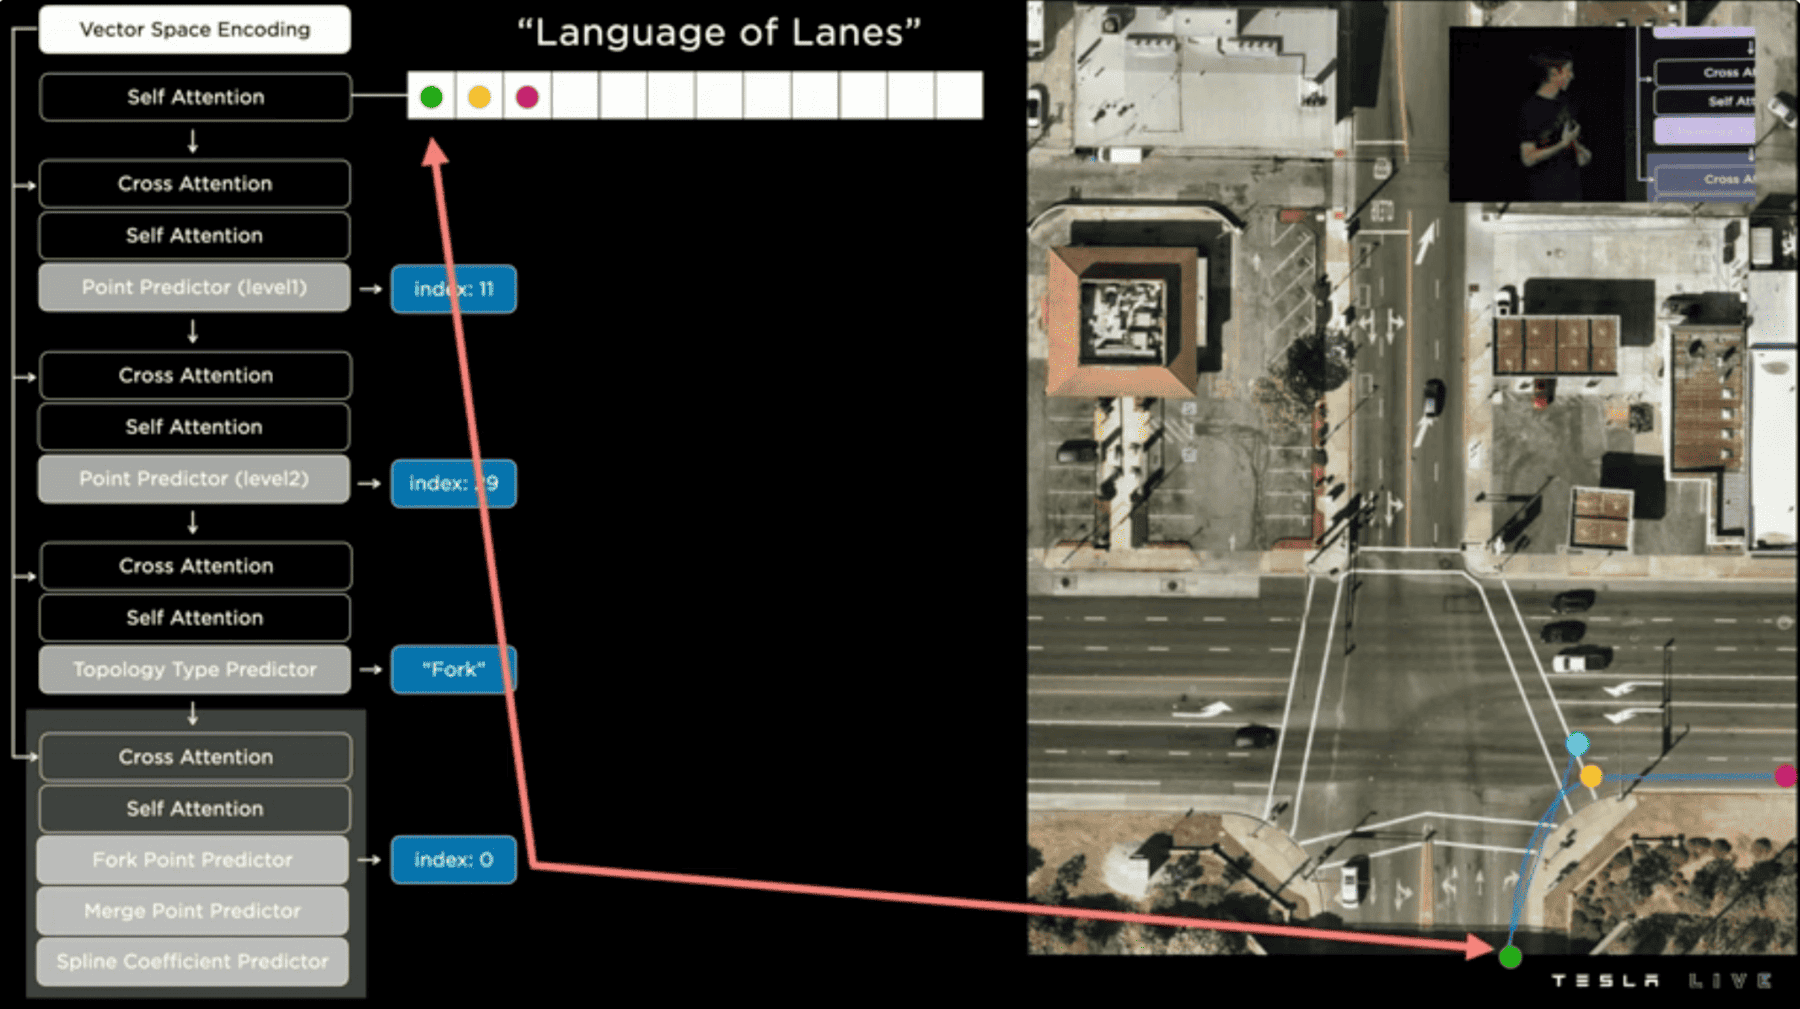
This extension is creating a "Language Of Lanes" that relies on tokens, embeddings, and learning continuity of a line. Yet, it seems much bigger than our other models, when asked about the complexity of their system:
ASHOK ELLUSWAMY (Autopilot Head): "We didn't do this just to create a complex model. We tried simple approaches, for example to segment the lanes along the road, but it cannot see the road clearly and tell a 2.5 lane situation."
When listening to their talk, my intuition was that their model was the #3 category, regressing coefficients of lines directly, but going through this language thing first. With End-To-End coming, this may disappear and simply become a lane line learning network, that helps the model predict the output, rather than predicting lane equations.
Summary & Next steps
- We used to implement many traditional techniques for lane detection, we now mainly use 3: Segmentation Based, Anchor Based, Parameter Based.
- Segmentation based approaches frame the problem as a segmentation problem; trying to map pixel values to classes, each class being a specific lane, or the background. Algorithms like LaneNet or SCNN are popular in this field.
- Anchor based approaches mimic object detection with the use of anchors; but for lines. Our goal will be to define anchors, and then calculate a deviation from these anchors of the detected lines. The model LaneATT is state of the art, and uses Attention based anchor generation.
- Parameters based approaches directly regress the polynomial equations of lines. We usually implement a third order polynomial (complex curve), with a fixed number of lines. Models like PolyLaneNet are top performers in this category.
- Every company is trying its own approach, like Tesla or Nvidia. The most popular algorithm of them all (and available on ROS) is probably LaneNet.
If you ever see a fire somewhere, the extinguisher may be your automatic reflex. If you have to build a robot, or self-driving car, this extinguisher will be lane detection. You now have access to these 3 categories, but others may exist or come up in the future. This is the case for row-wise line detection, that gained lot of popularity in the previous years, and that I kept out of this post.
On the other hand, companies like mobileye recently announced they were no longer using lane line detection for autonomous driving. Instead of being guided by white or yellow lines on the road, the system now follows precisely the route that other vehicles were driving on that road based on previously collected data.. This means that it's again a new approach to driving, using a fleet.
Next Steps
First, you could try and scan 1 or 2 papers from each category, this will likely give you a good intuition of how the approaches work.
- For segmentation papers, try to understand what are the categories they use? And how they do the classification?
- For anchor based papers, try and go to the implementation of one of these papers, and look at what the anchors are, and how they define them.
- For parameter based papers, try and see how the model generalizes and work with simple straight lines.
Second, lane detection is currently evolving to 3D, because fitting 2D curves is only an intermediate step before we project them to 3D. I might do a 3D line detection post, but in the meantime, I invite you to search for it, and try and do a similar clustering as I did for 2D (what are the different approaches? categories? differences with 2D?)