Point Clouds in Self-Driving Cars: 3 Things Perception Engineers Need to Know
In September 1519, an expedition of five ships and 270 men, led by Ferdinand Magellan, left Spain to reach the Spice Islands by sailing west. At the time, maps were crude sketches, full of blank spaces, and sometimes decorated with warnings: “Here be dragons.” Yet Magellan pressed on, steering his fleet into the unknown, through storms and across oceans no European had crossed before.
The challenge was harsher than anyone had imagined. Supplies ran out, men starved, and mutiny spread. One ship deserted, another wrecked. After nearly two years, Magellan reached the Philippines, where he was killed in the Battle of Mactan. His fleet, once five strong, was reduced to four… then three… then two.
3 years later, only one ship returned to Spain. The Victoria carried just 18 survivors, but also one of the greatest accomplishments of the time. For the first time, humanity had proof that the Earth could be circumnavigated by sea, a discovery that forever reshaped navigation, trade, and commerce.
For centuries, people believed the old maps. They trusted the flat drawings, the empty warnings, the “here be dragons”. All it took was one expedition to open a new world nobody could see. And today, I believe Computer Vision Engineers live in a similar situation.
The world provides Computer Vision algorithms, image processing techniques, 2D object detectors, and segmentation approaches... yet, the world is a sphere, in 3D. And this is why, I think something of much greater importance should be mastered by Computer Vision and ALL robotics/autonomous tech engineers: Point Clouds.
The goal of a point cloud is to create a 3D model. 3D points are a data representation used today in autonomous vehicles, robotics, AR/VR, and even in everyday objects like unlocking your phone with Face ID.
So what are point clouds? How do you get them? And how do you process them using AI? These are the 3 things I think most perception engineers should know, that we'll cover in this article.
Let's begin:
9 Examples of Point Cloud Data
A Point Cloud" is a set of points in 3D space — a cloud of points. Inside, each point holds the 3D location of a surface in the real world. It can be a person, a wall, a tree, anything. You probably know what a point cloud looks like already, but you may not know the multiple types of point clouds... So let me introduce you to 9 of them!
XYZ Point Clouds
In an XYZ point cloud, each point has a specific X, Y, and Z value. You could think of it as the equivalent of a pixel, but in 3D. Rather than just X and Y, we have X, Y, and Z (in most cases, because some point clouds are 2D, see this article).
Here's an example:
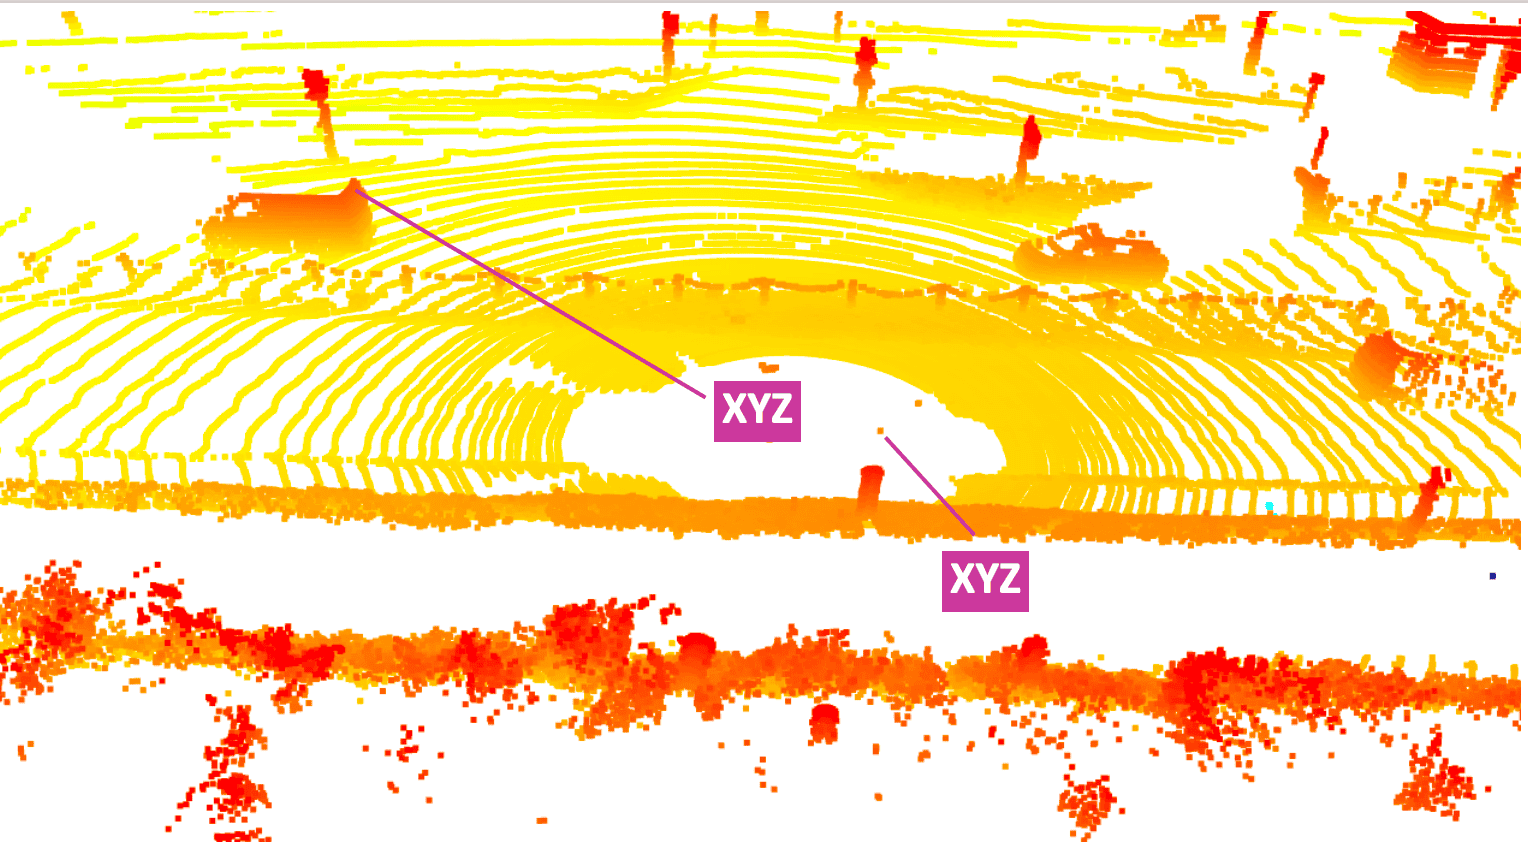
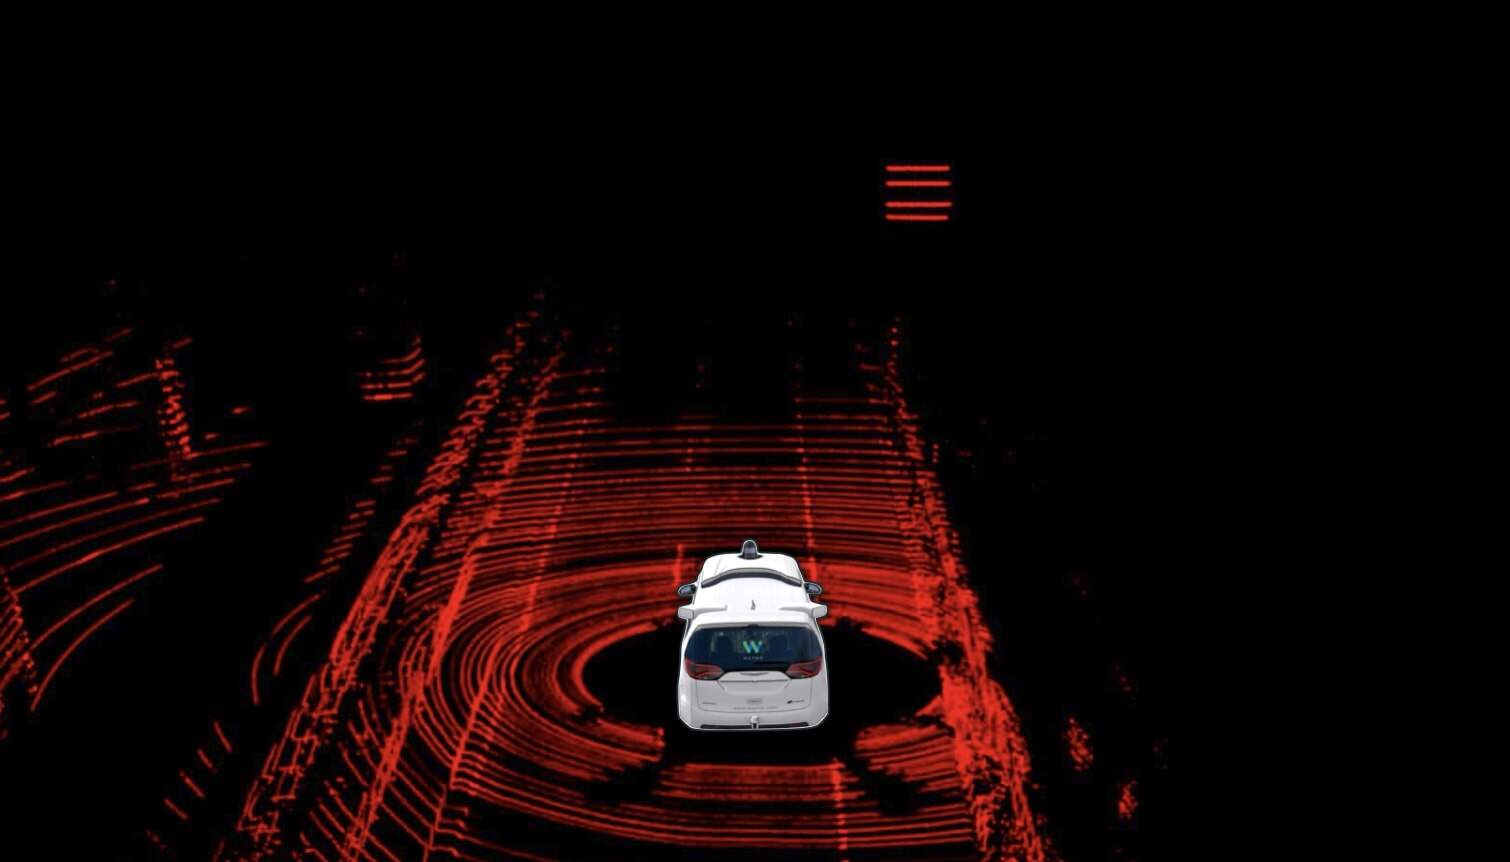
See? Each point has an XYZ value. But why are the colors different? Simply here because our visualizer is a gradient based on the height of the point (the Z dimension). The higher the Z value, the more red it'll be. On the above Waymo video, you could see a different visualization, based on the distance to the vehicle. So this is one type:
- Point clouds can contain the XYZ information
Next:
XYZ-I Point Clouds
Now, this is just an example, but let me show you something else...
This is another point cloud, but what do you notice about the colors? Yes, two things:
- It's all "RED"
- But not all points have exactly the same "red" value. Some are brighter than others
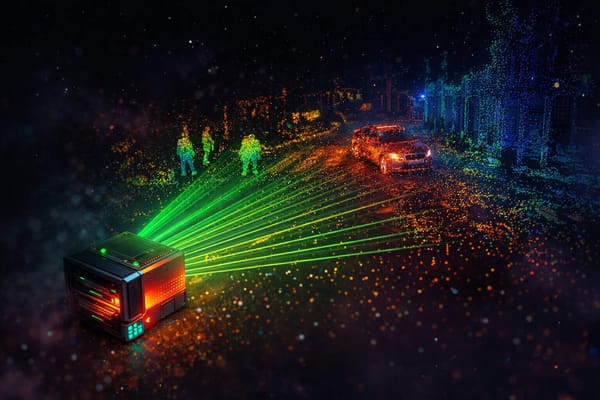
And this is because here, we are no longer visualizing the distance, but the "intensity" of the points. Point Clouds are often produced by LiDARs that send a ray and measure the time it takes to bounce back. This calculation measures the distance, but not all rays come back equal. Some are blocked by trees, leafs, or surfaces, while others perfectly go through.
So, we now know another attribute of a point cloud:
- Point clouds can contain the XYZ information
- Point clouds can also hold the intensity information!
Any other?
XYZ-V Point Clouds
Now, let's take it one step further, and look at this video:
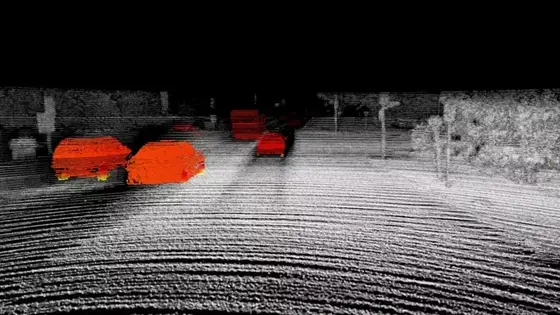
Okay, can you explain what is happening here? Everything is grey, but the vehicles. So, is that... Class? Labels? Or, wait a minute, why are the forward vehicles in red, the parked cars in grey, and the left approaching vehicles in blue? This is because, this visualization shows not the class but the velocity information!
This video has been made from Aeva, an FMCW LiDAR producer — and inside, you can see the points receding are in red, and those approaching are in blue. We now know a third possibility!
- Point Clouds can contain XYZ
- Or XYZ-Intensity
- Or XYZ-Velocity
Let's see 9 types of Point Clouds
Are there any more than intensity or velocity? Yes, in fact - each point can contain a lot of information. Let's see:
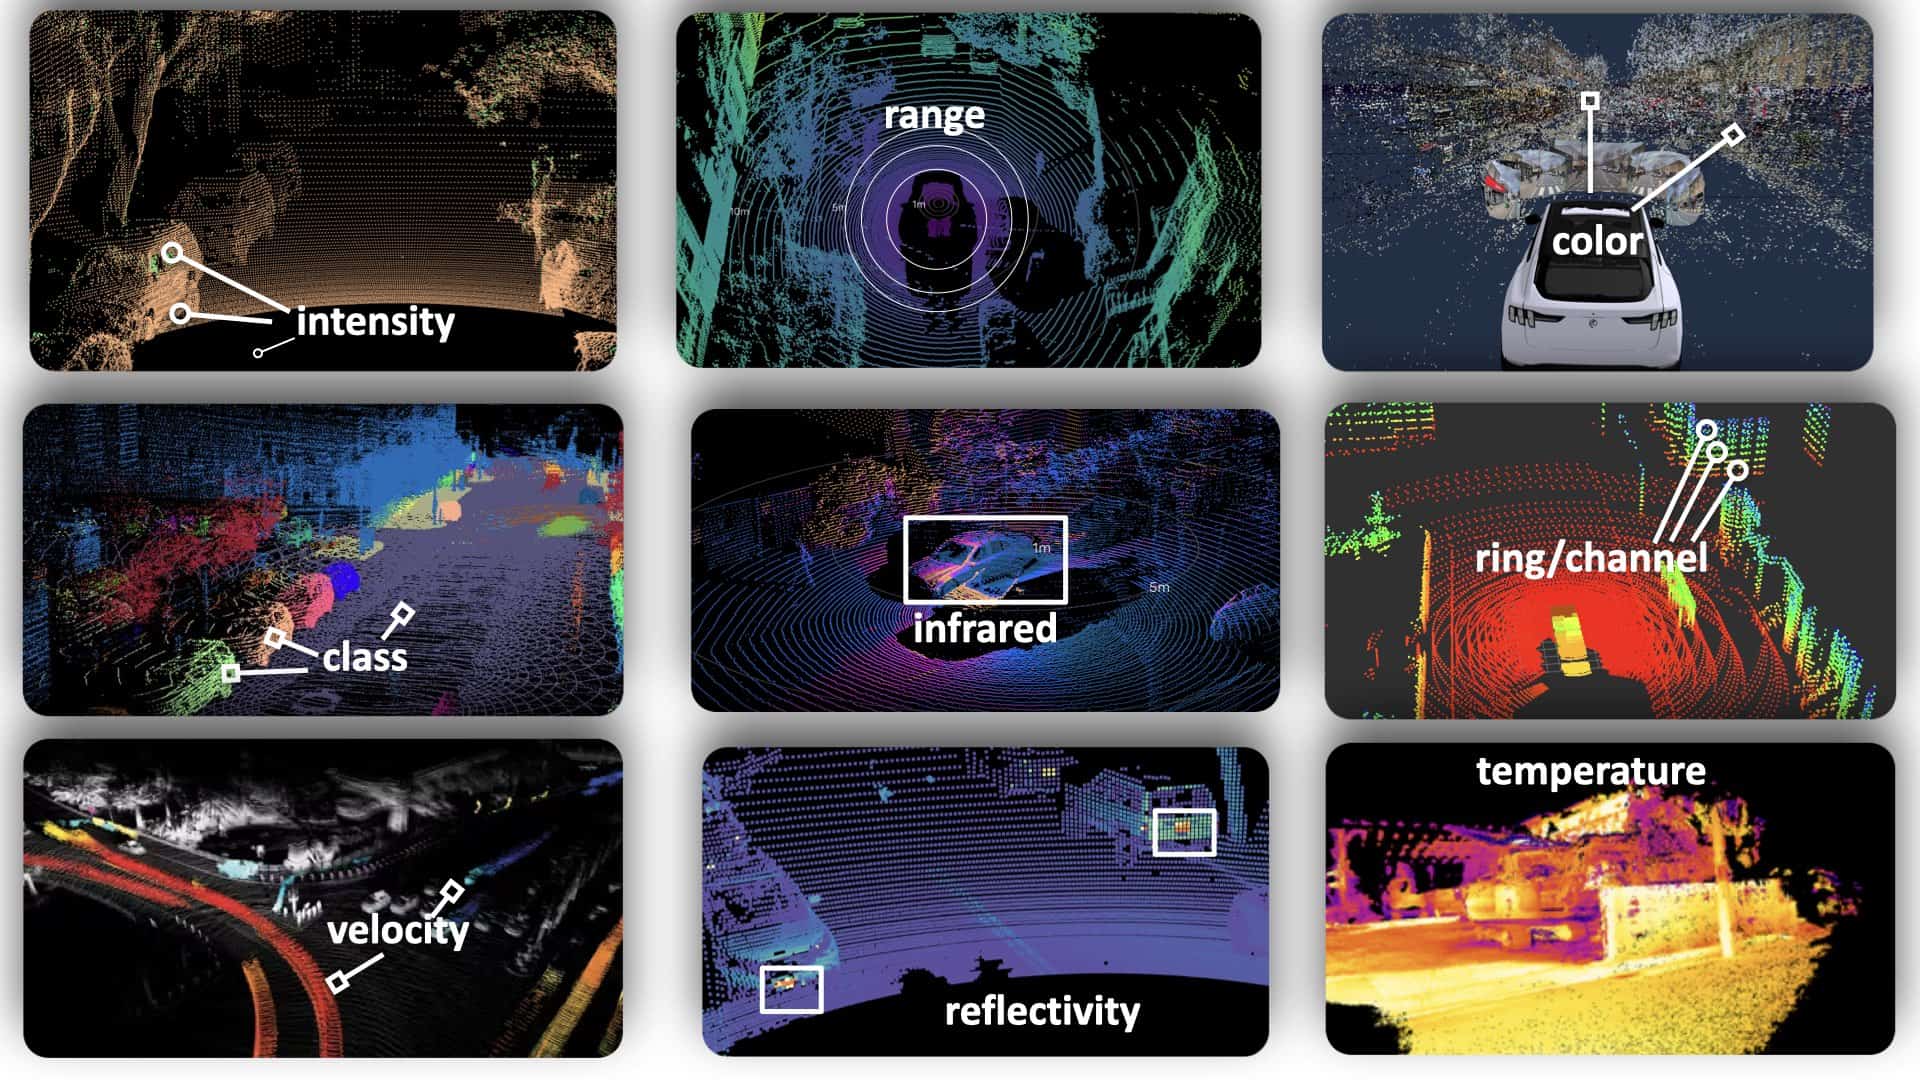
- Intensity - how strong the point clouds return signals are
- Range - the distance of the point, based on X, Y, or Z
- Color - the RGB color of the points (often for RGB-D cameras or 3D reconstruction)
- Class/Label - if it's after an object detector or segmentation tool processed it
- Infrared - the wavelength of the point cloud signal
- Ring/Channel - which channel of 3D sensors was used to collect it
- Velocity - the speed of each point (calculated by RADARs or FMCW LiDARs)
- Reflectivity - how reflective the surface of the point is
- Temperature - how hot a point is
Okay, but concretely, how does it work? Is there a TXT file where we store the points? Kinda, let's take a look...
Point Cloud Formats & Files
There are usually two types of files: ASCII and Binary. One is easier to read, the other is more suited to real-time/embedded. Take a look at the beginning of both files:
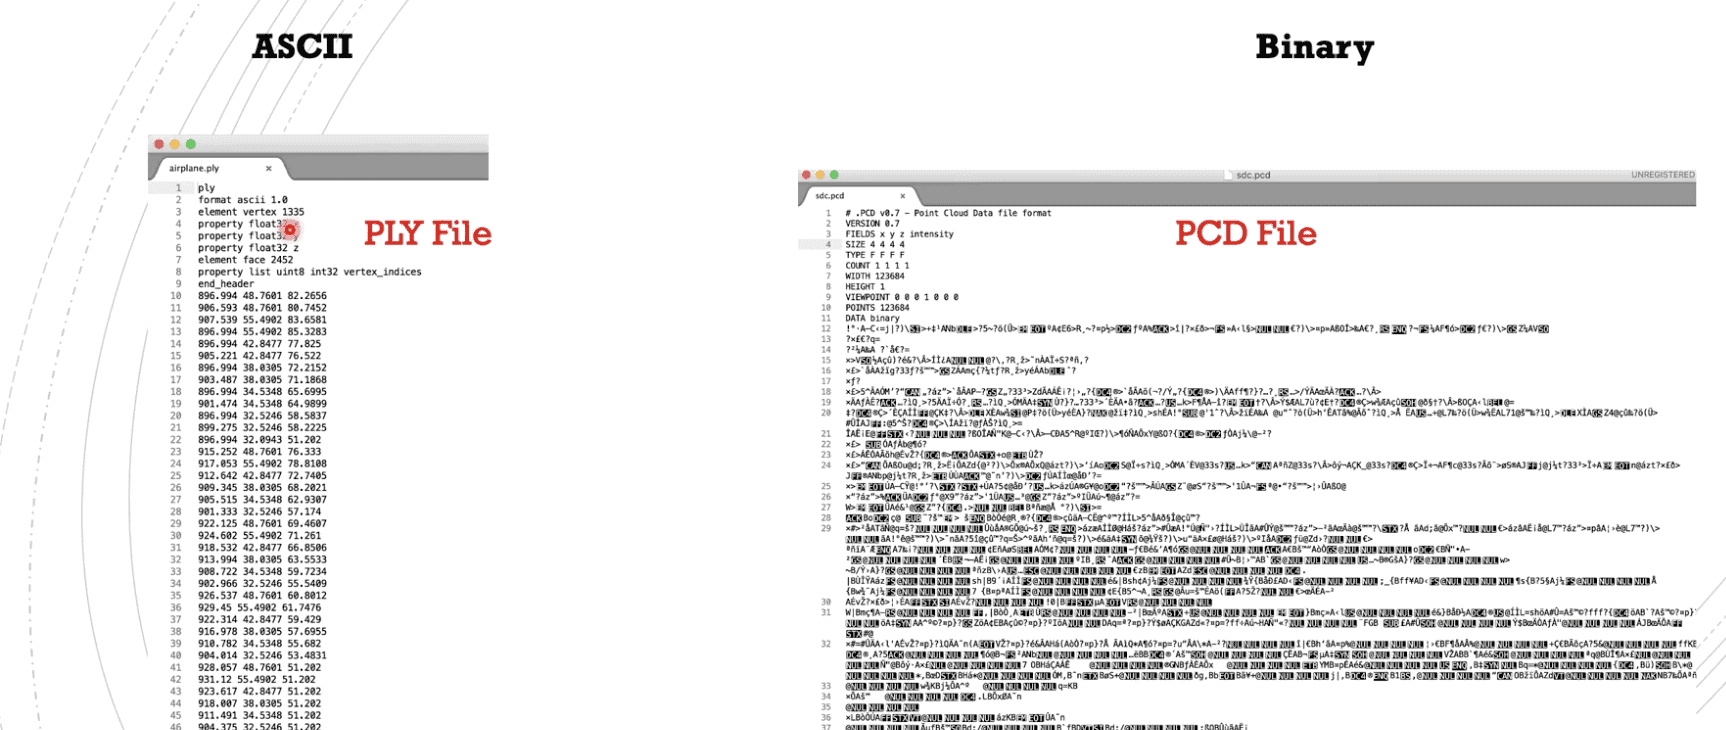
See? On the left, the PLY file contains X, Y, Z as floats, followed by a list of point coordinates. This is the point cloud! On the right, you can see a header describing the point cloud, in format XYZ-Intensity, and then, the points are not readable.
2 Main Ways to create a point cloud
There are basically 2 types of approaches, active and passive. Active techniques actively emit signals like light or sound to measure distances and create point clouds, such as LiDAR and structured light systems. In contrast, passive techniques rely on capturing existing environmental data, like photogrammetry, which reconstructs 3D points from multiple camera images without emitting any signals.
Active Techniques: LiDARs, RGB-D & RADARs
In the first case, point clouds come from sensors built to create them. When a camera takes a picture, it aims to get pixels. Well, when a LiDAR makes a measurement, its aim is to create a point cloud. Let's see 3 ways to do it:
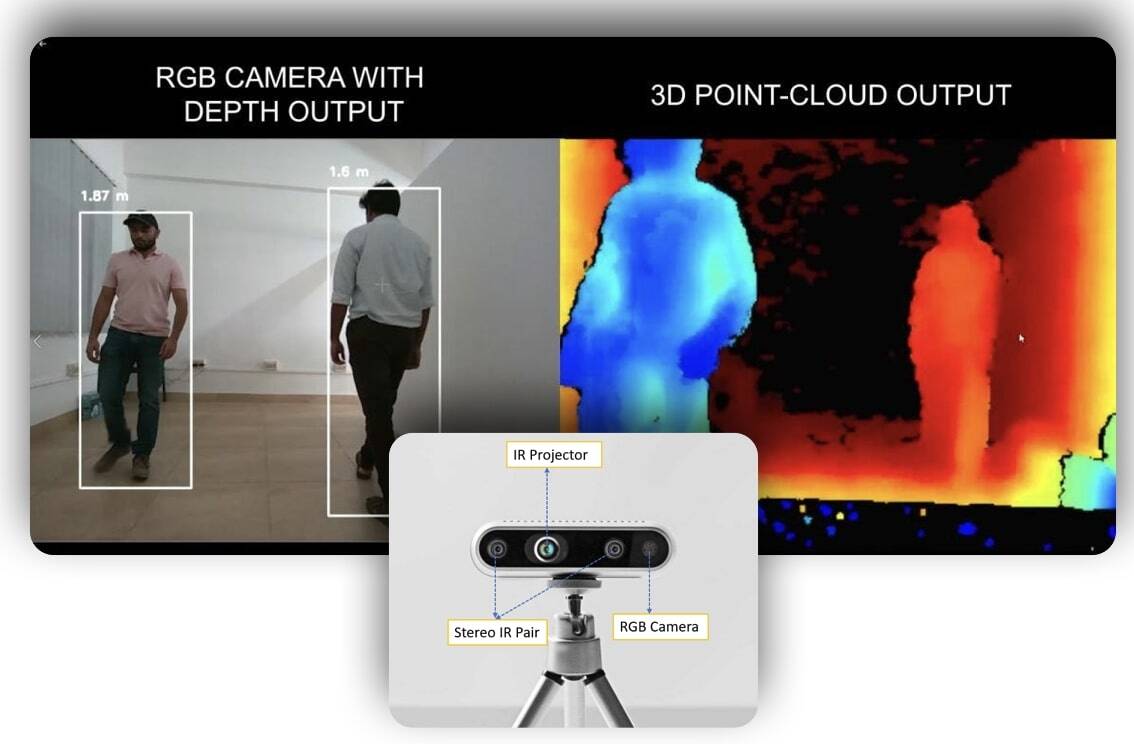
1) How to get point clouds using Structured Light RGB-D systems
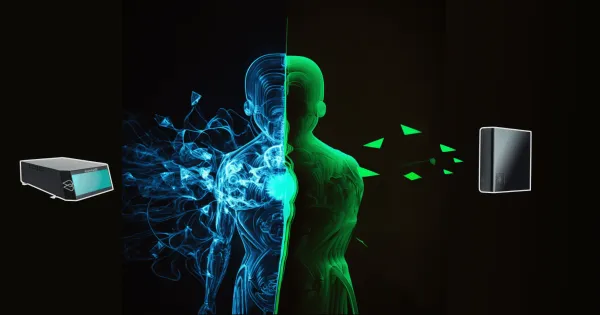
Ever played the Microsoft Kinect? I can't say that I have. I was a Wii player all the way when they were competing. Yet, I've always been impressed by how the Kinect produced point clouds using its RGB-D camera, working with the Structured Light Principle.
The Kinect shines a special pattern of light around, then uses an infrared camera to take a picture of how that light bounces back. By seeing how the pattern changes, the camera can figure out how far away things are. It combines this distance information with the colors it sees to create a 3D image called one final point cloud.
In robotics, you probably know the Intel Realsense 435i, or other equivalents. Their goal is to build a Depth Map, then turned into a point cloud.
2) How LiDAR point clouds are produced
The most common and popular technique is to use a LiDAR (Light Detection And Ranging). There are many types of LiDARs around, but let's focus on the simple Time-Of-Flight principle. In this setup, a laser scanner sends a light beam and measure the time it takes to reflect and come back to the receiver. Similar to this image:
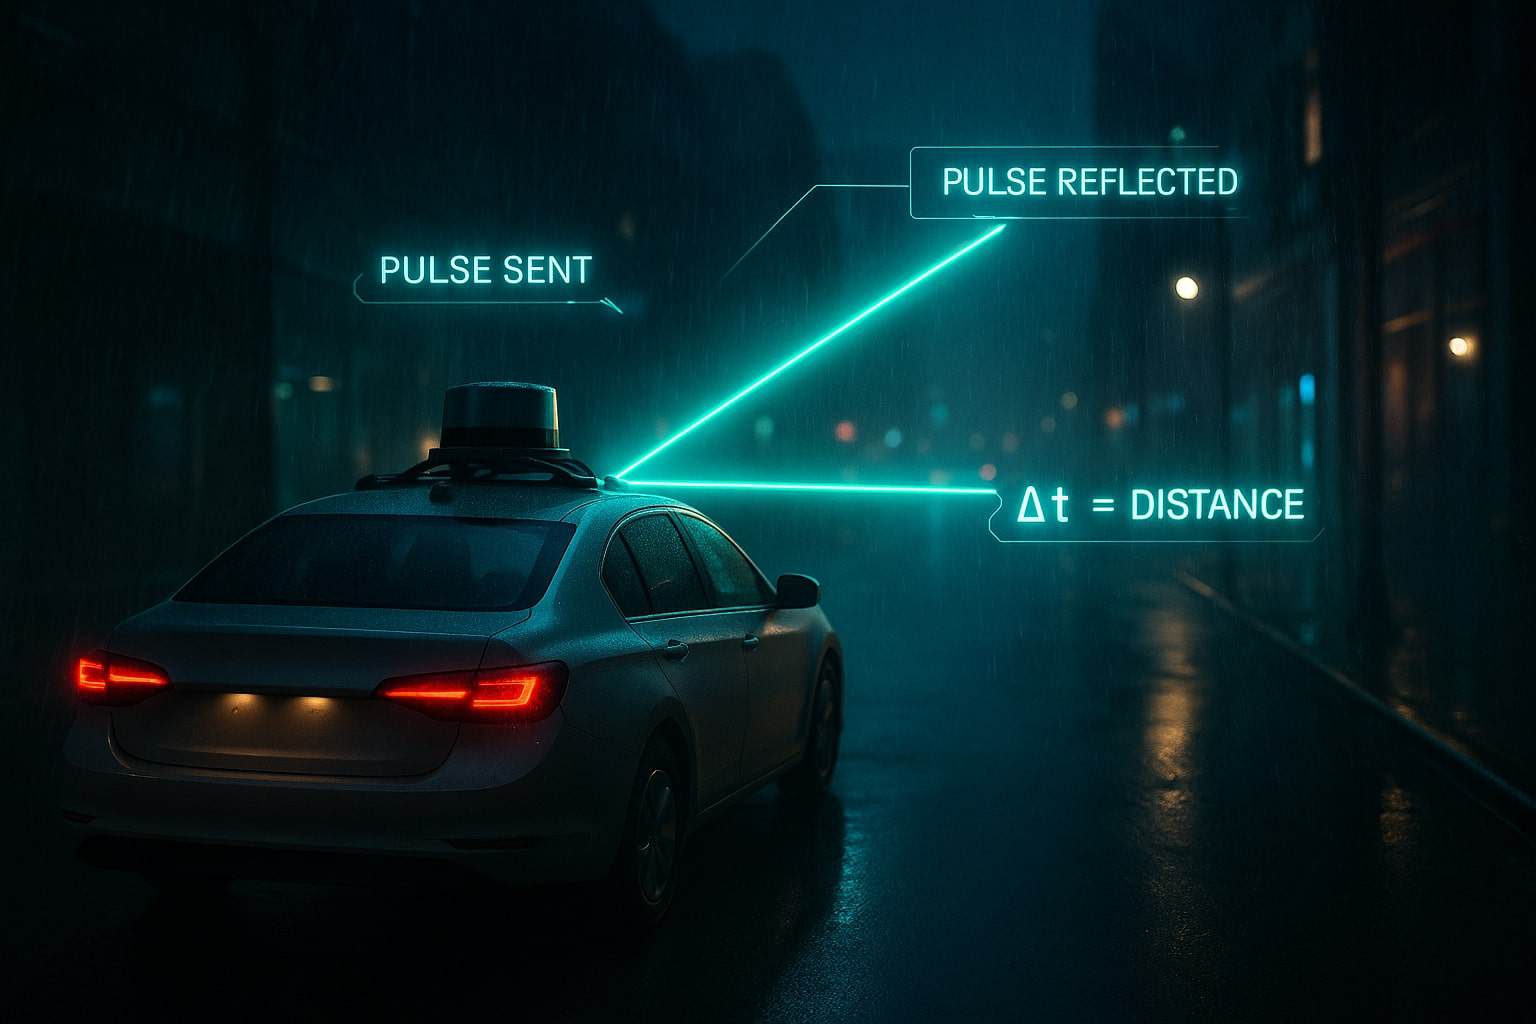
LiDAR scanners produce raw data of the world up to 300-400 meters in the automotive industry. Each scan can generate millions of points in the three dimensional space. I highly recommend checking my article on the types of LiDARs to learn more.
3) RADAR Point Clouds
The third technique is to use not a LiDAR but a RADAR to create the point cloud data. This is not very straightforward to do. RADARs usually return signal information based on Doppler (velocity), Range (distance), and Azimuth (direction/angle). Using these, we can do some calculations to retrieve the point cloud data.
Here is an example on a very low quality RADAR:
Today, we can use Imaging RADARs to get 3D point clouds. I invite you to check out my Imaging RADAR article to learn more about it.
Now that we've seen the Active ways, using sensors - I'd like to take a minute to talk about the passive ways.
Passive Point Clouds Generation: Photogrammetry & 3D Reconstruction
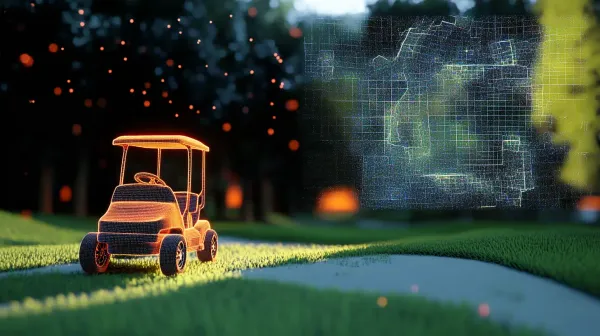
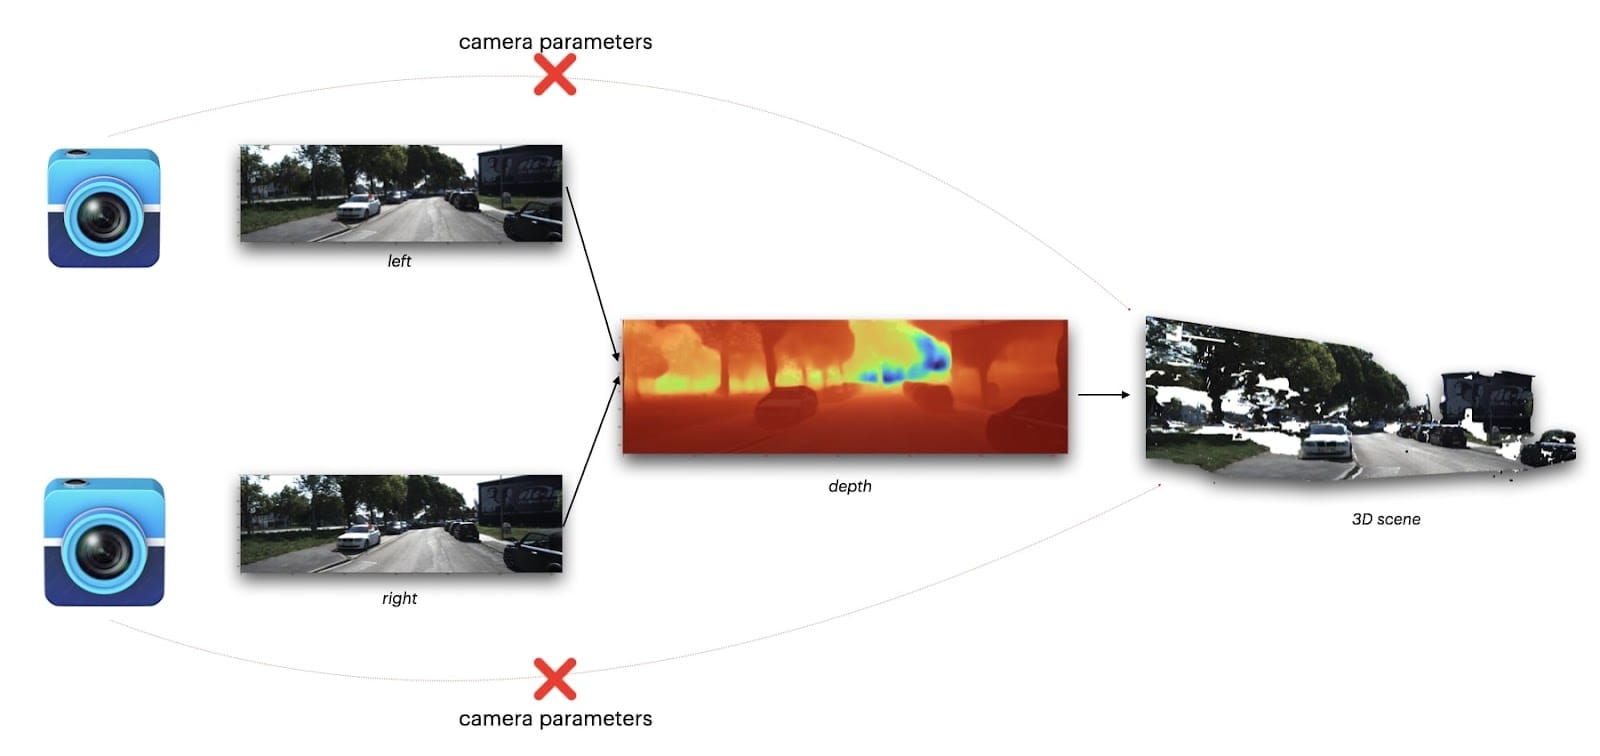
The idea of passive is that you do not attempt to create a point cloud from your sensors. The main way to do this is by leveraging 3D Reconstruction. Ideas like Structure From Motion, Multi-View Stereo, NeRFs, Gaussian Splatting, or others are used.
The idea? To convert 2 or more images to a 3D point cloud using triangulation, geometry, and depth maps.
If you're interested in this, I highly recommend reading my 3 article Series on PyImageSearch blog, or my article on Pseudo-LiDARs.
Alright, so you now know all about the point cloud types, and the ways to get them. One thing remains...
How to Process Point Cloud Data?
Do you remember in the point cloud types when I showed the "label/class" of each point? This is not something sensors can measure, it's built by algorithms. There are 3 things that really matter here:
- Understanding the main libraries/tools to work with
- Understanding the core algorithms to use on raw point cloud data
- Being able to use them in the applications
Libraries: Open3D and Point Cloud Library (PCL)
There are many libraries used to process point clouds. These implement the algorithms. For example, the Point Cloud Library is one of the most popular to work with. Open3D is also a very common one, it contains fewer algorithms, but is easier to process thanks to the Python interface. I would recommend to get started with this one.
On a similar topic, you could want to know at least one point cloud dataset. I would recommend you check out this article.
Which algorithms can be used to process point clouds?
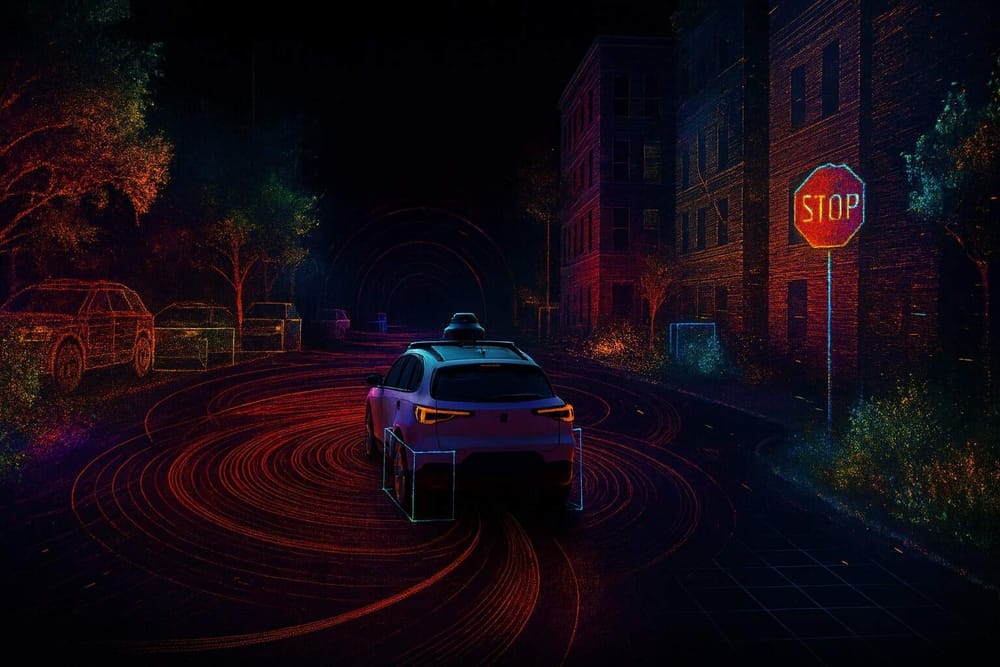
In point cloud processing, you can either go with traditional algorithms or 3D Deep Learning. The split is, I would say, dependent on the applications. When companies want to detect objects in 3D to get bounding boxes, they usually use 3D Deep Learning algorithms like PointPillars or VoxelNet. Let's see an example:
Outside of 3D Object Detection and 3D Segmentation, the entire world runs on traditional processing approaches. Since you have points, you can create tons of automated pipelines to process them. For example, you can do plane segmentation, clustering, outlier removal, normal estimation, point data cropping, surface reconstruction, filtering of unwanted data points, and so on, you'll use traditional approaches.
For example, you could calculate the surface normals and filter out the objects that belong or don't below to the street.
Another technique can involve point cloud registration and alignment. When you have multiple point clouds, for example coming from 2 LiDARs, you can align them together into a single object. An example below from one of my LiDAR courses, notice how we start with 2 point clouds, a blue and a red, and we end up aligning them perfectly. This makes something better than the raw data.
In the algorithm category, there are countless applications. Everything related to SLAM or Odometry is also extremely in use today.
Applications: Which jobs can you target with Point Cloud skills?
Regarding the applications, we could write an entire article. Yet, let me give you 3 or 4 core jobs you can target with point clouds processing skills:
- Perception Engineer, Autonomous Vehicles: Process LiDARs and RADARs to find objects in the 3D space. Use Sensor Fusion to mix the output with Computer Vision. Build autonomous vehicles, shuttles, delivery robots, and create the future.
- Nuclear SLAM Engineer, Robotics: Use point clouds processing techniques inside robots that explore caves or regions humans can't go to, such as nuclear sites, and build maps of the world.
- BIM Engineer, Architecture: Create digital models of buildings and structure by processing raw point cloud data captured from laser scanners or photogrammetry. These models help architects and engineers visualize object properties, plan renovations, and ensure precise construction. The role often involves using processing software to convert points into computer aided design (CAD) models, performing manual correction to refine the data, and integrating the results into architectural workflows for improved design and quality inspection.
- Medical Imaging Engineer: Apply point cloud techniques to CT-Scans, IMRs, and other 3D data types to detect diseases and save lives. There is both a commercial and research use.
- Drone Engineer, Agriculture: Process Cameras and RADARs/LiDAR information to navigate and help drones fasten agriculture and solve population needs.
- and many, many more...
Alright, now let's see a summary...
Summary & Next Steps
- A point cloud is a series of 2D or 3D points. A point cloud is to the LiDAR what a pixel is to a camera.
(Re-read that one.) - Each point of a cloud usually contains at least the XYZ information, but many sensors or technique allow to also get Intensity, Reflectivity, Velocity, Ring/Channel, Color, Temperature, Infrared, and more...
- A point cloud output format is of 2 types: ASCII or Binary. An ASCII file is more readable for humans, Binary is more readable for robots. Each file is a list of points and their information.
- There are 2 ways to build a point cloud: Active and Passive. Active techniques involve sensors like LiDARs, RADARs, or RGB-D cameras, while passive techniques use photogrammetry and 3D reconstruction to retrieve 3D models.
- Point Clouds Processing typically involves 3 stages: the tools/libraries, the algorithms, and the applications. Tools are libraries like Open3D or PCL, algorithms are either traditional or deep learning, and applications go from self-driving cars to robotics, drones, augmented reality, the architecture industry, agriculture, and beyond.